
Google Lighthouse Score: What It Actually Tells You About Your Website
A lot of business owners hear “Google Lighthouse score” and assume it is a hidden grade Google gives their website behind the scenes. That is close enough to be useful, but not accurate enough to make good decisions. Lighthouse is better understood as a diagnostic tool. It gives you a structured way to see where your site is weak, where it is strong, and what technical issues may be getting in the way of a better user experience. Google’s own documentation describes Lighthouse that way: an automated tool for improving the quality of web pages.
That distinction matters because a website does not grow by chasing a prettier score. It grows when the score points you to changes that make the site faster, easier to use, easier to trust, and easier to understand. That is the difference between treating Lighthouse like a vanity metric and using it the way it is actually meant to be used.
What Google Lighthouse actually measures
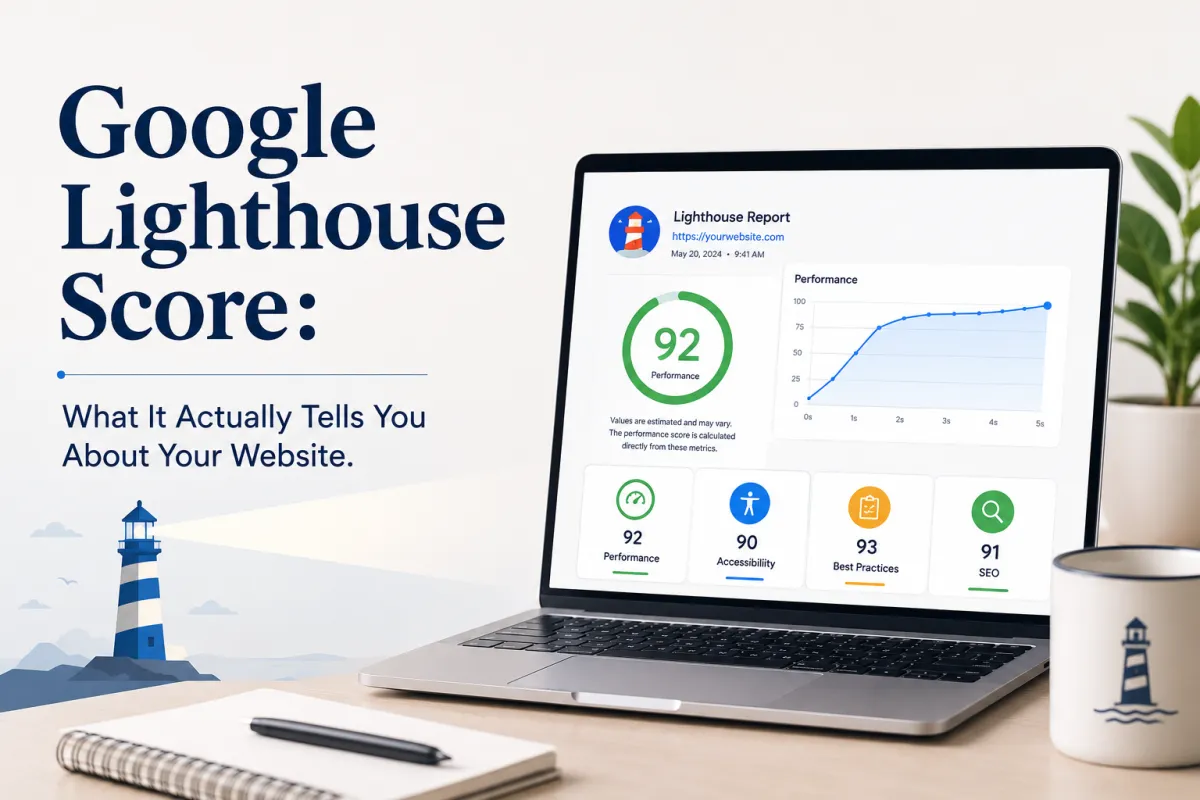
The old version of this blog framed Lighthouse as a five-part scorecard. That needs an update. In PageSpeed Insights and Chrome DevTools today, the core Lighthouse categories most business owners will care about are Performance, Accessibility, Best Practices, and SEO. Google’s PageSpeed Insights documentation says it uses Lighthouse in a simulated environment for those categories, and the DevTools documentation lists the same four categories in the Lighthouse panel. PageSpeed Insights release notes also note the removal of the old PWA category in Lighthouse 12.
Those categories matter for practical reasons. Performance tells you how the site loads and responds. Accessibility helps catch issues that make the site harder to use for people with disabilities or assistive technology. Best Practices surfaces technical and security-related problems. SEO checks for some of the fundamentals that help search engines understand the page. Lighthouse is useful because it gives all of that a consistent framework instead of leaving teams to guess where the technical drag is coming from.
Why business owners should care
This is where the tool becomes more than a developer report.
Website speed and usability affect the way people experience the business. Google’s web performance guidance says websites that load quickly and respond in a timely way engage and retain users better than sites that are slow or sluggish. Google’s Search documentation also says site owners should aim for good Core Web Vitals because they reflect real-world user experience for loading, interactivity, and visual stability.
That matters because Lighthouse often gives you the fastest window into problems that customers can feel but cannot name. A site may look fine to the internal team and still feel slow, unstable, or frustrating to a first-time visitor. Lighthouse helps expose that friction earlier. When a business relies on its site to generate leads, sales, or trust, that kind of visibility becomes useful fast.
Why the score matters less than the diagnosis
A lot of people focus on the top-line number because it is easy to compare. Google even gives performance score ranges inside PageSpeed Insights, with 90 and above considered good, 50 to 89 needing improvement, and below 50 considered poor. At the same time, Google’s Lighthouse scoring documentation makes an important point: the Performance score is a weighted average of metrics, and improving opportunities or diagnostics only affects the score indirectly by improving those underlying metrics. Google also says score fluctuations can come from changes in conditions and that it is often more useful to think of performance as a distribution rather than a single score.
That is why we do not think businesses should obsess over getting a perfect 100. A cleaner score is useful when it reflects a better site. A perfect-looking score that distracts the team from real user problems is not the win people think it is. The business value comes from the fixes the score points to, not from the number itself.
Lighthouse is lab data, not the whole story
This is one of the biggest value gaps in the old article.
Lighthouse runs in a controlled lab environment. Real customers do not. Google’s PageSpeed Insights documentation says PSI combines field data from the Chrome UX Report with lab diagnostics from Lighthouse. Chrome’s CrUX guidance makes the difference even clearer: CrUX reflects real-user experiences from the field, while Lighthouse is a controlled test in the lab.
That means Lighthouse is best used for diagnosis and prioritization. It helps you understand what is likely slowing the page down or weakening the experience. If you want to know how real people are actually experiencing the site over time, you need to look at field data too. That is why we usually use Lighthouse and field data together. The lab view shows where to investigate. The field view shows whether the issue is affecting real users at meaningful scale.
Where Core Web Vitals fit in
Core Web Vitals are where this conversation becomes more actionable for a business owner. Google recommends good Core Web Vitals and defines clear targets for them. For example, it recommends Largest Contentful Paint within 2.5 seconds, Interaction to Next Paint below 200 milliseconds, and Cumulative Layout Shift at 0.1 or lower. Google also recommends evaluating these thresholds at the 75th percentile across mobile and desktop experiences.
That is useful because it gives the business a more grounded way to think about performance. Lighthouse can show you the likely causes. Core Web Vitals help you understand whether the experience users are actually having is good enough. When those two views line up, the work becomes easier to prioritize.
What Lighthouse usually helps uncover first
In practice, Lighthouse is often most useful because it gives teams a starting point. It can reveal oversized page payloads, missing or weak meta descriptions, accessibility issues, or technical patterns that make the site heavier than it needs to be. Google’s Lighthouse documentation includes specific audits for avoiding enormous network payloads and for missing meta descriptions, and its accessibility scoring documentation explains that the Accessibility score is based on weighted accessibility audits.
That matters because a lot of businesses have more site friction than they realize. The website may still be producing leads or sales, but it is doing it with extra drag. Lighthouse is often the fastest way to see some of that drag in one place.
How we think about Lighthouse inside a growth system
We do not look at Lighthouse as a separate technical exercise. We look at it as one of the tools that helps us understand whether the website is helping the business or quietly slowing it down.
That is the bigger reason this matters. A site that loads poorly, shifts visibly, or makes simple actions harder than they need to be puts more pressure on every other part of the growth system. Paid traffic gets more expensive. Organic traffic converts less efficiently. Customer trust has to work harder. Our free guide and training walks through how we think about growth, systems, and scale, and website performance fits directly into that. If the site is the place where everything else lands, then technical clarity matters more than most businesses think.
What to do next
If you have never looked at your site through Lighthouse, start there. Use it to see where the obvious technical friction is, then compare what you find against field data in PageSpeed Insights so you are not making decisions from lab results alone. Once you know where the biggest issues are, you can make better calls about what to fix first and what is just noise.
If you want help identifying which site issues are worth solving now and which ones can wait, book a call with us. We can help you sort out what is affecting user experience, what is affecting search visibility, and what will actually move the business forward.
