
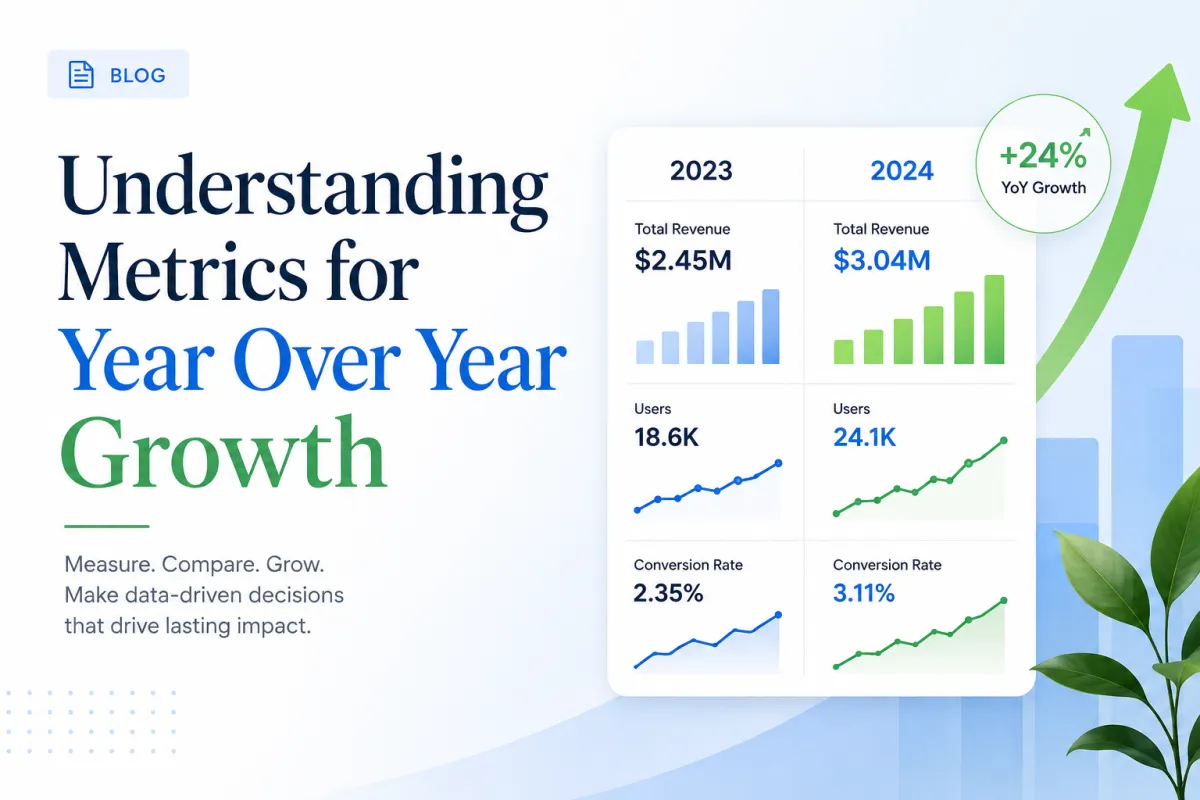
Year-Over-Year Growth Metrics: Which Numbers Actually Matter
A lot of businesses are buried in dashboards and still do not feel clear on whether the business is actually getting healthier. They can tell you what their click-through rate did last week, what one campaign spent yesterday, and which ad got the most engagement, but when you ask whether the company is in a better position than it was this time last year, the answer gets blurry fast.
That is usually where the problem starts.
Year-over-year growth is not a metric by itself. It is a way of checking whether the business is becoming more efficient, more durable, and easier to scale over time. If you want that answer, you need more than one number.
Why surface-level metrics create bad decisions
The old version of this blog was directionally right about ROAS, CTR, and campaign performance, but it stopped too early. Those numbers matter. They just do not mean much in isolation.
We see this all the time. A brand improves ROAS and thinks the account is healthier, but new customer volume is down. Another brand gets a better CTR and assumes the ads are stronger, but the landing page is still leaking conversions. A third brand sees one campaign outperform and pushes more spend into it without noticing that repeat purchase behavior is getting weaker across the store.
That is why we do not like dashboard tourism. We want to know what the number is telling us, what it is hiding, and what decision it should change.
ROAS is useful, but it is not the whole story
ROAS still matters. If you are spending on paid media, you need to know whether the revenue coming back justifies the spend. Google Ads’ guidance on Target ROAS bidding makes the logic pretty clear: the platform is trying to maximize return by predicting the value of a potential conversion and adjusting bids toward that outcome.
That matters because ROAS is one of the fastest ways to see whether media efficiency is moving in the right direction.
It also gets overused.
A campaign can have a decent ROAS and still be weak for the business if it is mostly harvesting existing demand, discounting too aggressively, or failing to bring in enough new customers. A brand can also push ROAS higher and quietly choke scale if the account becomes too restrictive.
We treat ROAS like a decision metric, not a trophy. It helps us understand whether the spend is productive, but we still want to know what kind of revenue is coming back, how profitable it really is, and whether the account is helping the business grow in a way that can hold up next quarter too.
CTR tells us whether the ad is earning attention
Google Ads defines click-through rate very simply as clicks divided by impressions. That is useful because CTR is one of the clearest ways to understand whether the ad is resonating enough to earn the next action.
If CTR is low, the message may be weak, the targeting may be off, or the creative may not be doing enough to stop the scroll or win the click.
That does not mean high CTR automatically equals good performance.
CTR tells us the ad is getting attention. It does not tell us whether that attention turns into qualified traffic, better conversion, or stronger revenue. We use it as an early read on relevance and message quality. Then we check whether the rest of the funnel is keeping up.
That distinction matters for the kind of buyer we want. They are not looking for prettier reporting. They want to know what to keep, what to cut, and what to fix next.
Campaign performance only matters when you compare it to the right thing
The phrase “campaign performance” sounds more useful than it usually is.
A campaign can look strong compared to another campaign and still be weak compared to what the business actually needs. That is why we do not just compare campaigns against each other. We compare them against business goals.
Did this campaign bring in better customers?
Did it support a stronger landing page conversion rate?
Did it generate more efficient revenue over time?
Did it create volume that the rest of the system could actually absorb?
That is the level where campaign analysis starts becoming strategic.
Sometimes the right move is shifting spend into the healthier campaign. Sometimes it is holding back until a creative refresh is ready. Sometimes it is fixing the page before touching the budget. The point is that campaign performance should lead to a decision, not just a screenshot in a report.
The metrics the old version missed
This is where year-over-year growth gets more honest.
If you really want to understand whether the business is improving, we would add a few more numbers to the conversation.
1. Total sales over time
Shopify’s sales reports let you compare sales over time, by channel, and by product. That matters because year-over-year growth should still answer the most basic question first: is the business generating more revenue in a healthier way than it did before?
2. New vs returning customers
Shopify’s new vs returning customers report is one of the simplest ways to see whether growth is being carried only by acquisition or whether retention is doing its job too.
This is one of the first places we look because a business can “grow” year over year and still be in a weaker position if it is paying too much to replace customers it should have kept.
3. Channel contribution
A lot of businesses still talk about paid media as if it exists in a vacuum. It does not. If paid is growing but email, SMS, or owned traffic are flat, the business may be leaning too heavily on acquisition.
That is one reason benchmark context matters. Klaviyo’s 2026 benchmarks show that flows outperform campaigns heavily on click rate and placed order rate, which reinforces something we see in real accounts all the time: owned channels usually do more of the compounding work than businesses give them credit for.
4. Conversion path quality
This is where campaign metrics and website metrics need to be read together. If CTR improves but conversion rate stalls, the ad may be stronger while the landing page is still weak. If ROAS dips while the site is underperforming, the media team may be paying for a web problem.
That is why we like reading metrics in layers instead of one at a time.
What a healthier year-over-year read actually looks like
When we review growth year over year, we want a cleaner picture than “ROAS went up.”
We want to know:
whether revenue increased
whether acquisition efficiency held or improved
whether the ads earned stronger attention
whether new customers are coming in at a healthy pace
whether returning customer behavior is improving
whether owned channels are carrying more of the load
whether the conversion path is getting easier to trust
That is what tells us whether the business is getting stronger or just working harder.
If you want the bigger framework we use to interpret those numbers and turn them into actions, our free guide and training is the best place to start.
What to watch for when the numbers disagree
This is where a lot of businesses get stuck. One metric goes up, another goes down, and the team does not know what deserves more weight.
That is normal.
If CTR improves and ROAS falls, the ad may be doing a better job attracting attention than the offer or page is doing closing it.
If ROAS improves and new customer volume falls, the account may be becoming more efficient at harvesting existing demand than creating fresh growth.
If total sales rise but returning customer rate slips, the business may be buying growth that will be harder to sustain later.
If email contribution stays flat while paid spend keeps climbing, the business may be neglecting one of the easier profit levers in the system.
The point is not to find one magic number. The point is to read the business honestly enough that the next move becomes clearer.
Why this matters to the kind of client we actually want
The right buyer for us is usually already looking at these dashboards. They are not asking what ROAS stands for. They are asking why the business still feels harder to scale even when reporting looks decent.
That is the execution gap.
They have enough education already. What they need is a better way to interpret the data, prioritize what matters, and stop reacting to whichever metric happens to look loudest that week.
That is also why this kind of article matters more than another basic metrics explainer. We are trying to help operators make better decisions with the numbers they already have.
What to do next
If your team is reviewing performance every week and still feels unclear on whether the business is actually getting healthier, start by reducing the number of vanity reads in the conversation.
Look at revenue over time. Look at new vs returning customers. Look at ROAS and CTR together, not as separate trophies. Look at channel contribution. Look at whether the store is becoming easier to convert and easier to retain.
Once those numbers are in the same conversation, year-over-year growth gets a lot easier to judge.
If you want a clearer framework for doing that with us, start with our free guide and training.
